The plot thickens...
So here we are at the end of the second week of the program. To recap a bit, we are looking at ways to model disease spread over large geographical areas. We'll be using a cluster to parallelize the algorithm in order to run our simulation in a more efficient manner. So with that knowledge, let's discuss this a bit further.
Cluster Computing
Let me discuss this topic a bit more in detail to explain what I mean when I say things like "cluster" and "cluster computing". A cluster is generally several computers networked together working towards a single goal. This can involve 2 computers or thousands. In the latter case, these tend to be defined as supercomputers. In my last post, I detailed the specs of our cluster we use in the lab. This becomes extremely useful when working with large sets of data. We can spit up the work across all of our machines (nodes) in order to exponentially speed up our work. Think of it this way: If a single construction worker tried to build a house, it would take a very long time. However, if we add several workers to the job, they can split the duties and complete the house much faster than a single worker. In computer science, we take algorithms that can take a long time, and try to find ways to split the work into multiple tasks that can be worked on simultaneously.
Large Graphs
For the problem we are trying to solve, we end up having to use graphs to store a lot of our data. We aren't talking about bar graphs or line charts. These are a data structure in computer science which involve a set of vertices connected by a set of edges. For example:
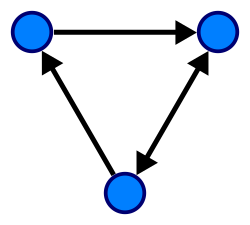
This is a graph with 3 vertices (nodes)
Now the example presented above is a relatively small graph. The graphs we will be using in our simulation will consist of thousands (possibly millions) of nodes. This is because we will be using a graph to represent various locations in our geographical area. Each node can contain a number of agents in which we must process and determine any health changes as well as determine the agent's next possible location.
For a given node, we will need to examine the adjacent nodes to determine if a given agent should travel to that particular node. Even further than that, a given agent may need to travel to a node which is several nodes away from its current location. This could be due to parameters such as age (agent is traveling to school) or financial classification (expensive housing is located further away). In this situation, we will need to find a path (more specifically the best path) to the agent's desired location. Many algorithms exist for this situation. We will be utilizing Breadth First Search (BFS) as it will provide an adequate solution for our case. With such a large graph this can take a long time. This is because the algorithm examines each adjacent node, then it looks at each adjacent node to those, and each adjacent to those, and so on and so on. This adds up not only as our graph grows large, but also with the number of agents this must be performed for.
Enter cluster computing
So obviously we have a problem that will hinder our simulation's performance immensely. Thankfully, there are a few ways we can parallelize this problem to take advantage of our cluster's computing power. First, we can split up our graph into sub areas. Think of this like different areas of your city, taking Fort Worth as an example, we could section it into the Hulen area, Ridgmar, Downtown, and so on. We can then assign the areas to an individual processor. So on our cluster, we could section our geographical area into 16 sub areas (8 machines, 2 processors each). Any more than this and we risk hurting our performance more than we can boost it. Now we have 16 smaller graphs that are more manageable and a bit easier to traverse. Now we still have a problem where path finding could take a while especially at one node at a time. One thing we could do is modify our BFS algorithm to be a bit similar to the A* search algorithm. Since we will have a known distance between each node, which is called a weight, we can use this to help determine if the nodes we are searching are getting us closer to our destination or further away. Additionally, we can utilize the multiple cores on our processor to examine several nodes simultaneously to speed up the process of finding a path.
This simulation will grow very complicated, very quickly. Therefore, we will need to be careful writing the algorithm to keep from breaking things or causing our code to become ugly and messy. Smaller sub-experiments should be utilized to ensure parts of the algorithm will behave the way we expect.
Software Testing
Dr. Mikler has returned this week, so we've had some time to discuss plans for the summer. Rather than focus on the software testing of the cluster, he has asked me to develop a testing solution for the ACM Abstract Repository website, where students may submit abstracts for papers they are writing for peer review. I was just recently given access to this code so I am in the process of examining the code to find points of potential failure. Once I have a complete idea of the functionality of the site, I can begin developing tools to test parts of the site to ensure the code will not fail when presented with various types of input. I plan to research and utilize PHP unit testing tools to aid in this task.
We have discovered much this week. Stay tuned, and we just might see some mini experiments next week.
